판다스 모듈 import
import pandas as pd
파일 DataFrame으로 로딩
read_csv()
CSV(column을 ','로 구분한 파일 포맷) 파일 포맷 변환을 위한 API
CSV 뿐만 아니라 어떤 필드 구분 문자 기반의 파일 포맷도 DataFrame으로 변환 가능
이를 위해서 read_csv()의 sep 인자에 해당 구분 문자를 입력하면 됨
sep 인자의 default는 sep=','
ex) 탭으로 필드가 구분되어 있다면 sep='\t'
titanic_df = pd.read_csv('titanic_train.csv')
read_table()
read_csv()와 read_table()은 기능상 큰 차이가 없으나 가장 큰 차이는 필드 구분 문자(Delimeter)가 ','인지 '\t'인지의 차이
그래서 주로 read_csv()를 씀
read_fwf()
Fixed Width, 즉 고정 길이 기반의 칼럼 포맷을 DataFrame으로 로딩하기 위한 API
참고하면 좋은 링크:
read_csv() : read_csv()의 다양한 활용
파일 경로 : 절대 및 상대 경로 입력 방법
DataFrame 읽기
df.head()
DataFrame의 맨 앞 일부 데이터만 추출
default 값은 5
titanic_df.head(3)
df.tail()
DataFrame의 맨 뒤 일부 데이터만 추출
default 값은 5
titanic_df.tail(3)
df.columns
DataFrame의 column들을 <class 'pandas.core.indexes.base.Index'> 타입으로 반환
titanic_df.columns
df.index
DataFrame의 index를 <class 'pandas.core.indexes.range.RangeIndex'> 타입으로 반환
titanic_df.index
df.index.values
DataFrame의 index의 값을 ndarray 타입으로 반환
titanic_df.index.values
df.info()
DataFrame 내의 column 명, 데이터 타입, Null 건수, 데이터 건수 정보를 제공

df.describe()
데이터값들의 평균, 표준편차, 4분위 분포도를 제공
숫자형 컬럼들에 대해서 해당 정보를 제공
- count: not null인 데이터 건수
- mean: 전체 데이터의 평균값
- std: 표준편차
- min: 최솟값
- max: 최대값
- 25%: 25 percentile 값
- 50%: 50 percentile 값
- 75%: 75 percentile 값

series.value_counts()
해당 column 값의 유형과 건수를 확인
반환 결과는 많은 건수 순서로 정렬되어 값을 반환
DataFrame은 value_counts() 메소드를 갖고 있지 않기 때문에 반드시 column 명을 추출
지정된 column의 데이터 값 건수를 반환
참고로 DataFrame에서 추출한 column의 type은 Series
titanic_df['Pclass'].value_counts()

/*
retrun: 3    491
        1    216
        2    184
        Name: Pclass, dtype: int64
*/
DataFrame과 리스트, 딕셔너리, 넘파이 ndarray 상호 변환
넘파이 ndarray, 리스트, 딕셔너리를 DataFrame으로 변환하기
ndarray → DataFrame: pd.DataFrame
col_name=['col1', 'col2', 'col3']
array2D = np.array(list2D)
df_array = pd.DataFrame(array2D, columns=col_name2)
리스트 → DataFrame: pd.DataFrame
col_name=['col1']
list = [1, 2, 3]
df_list = pd.DataFrame(list, columns=col_name)
딕셔너리 → DataFrame: pd.DataFrame
일반적으로 딕셔너리를 DataFrame으로 변환 시에는 딕셔너리의 key는 column 명으로, value는 key에 해당하는 column 데이터로 변환
dict = {'col1':[1, 11], 'col2':[2, 22], 'col3':[3, 33]}
df_dict = pd.DataFrame(dict)
DataFrame을 넘파이 ndarray, 리스트, 딕셔너리로 변환하기
DataFrame → ndarray: df.values
DataFrame을 ndarray로 변환하는 것은 DataFrame 객체의 values를 이용해 쉽게 할 수 있음
array_dict = df_dict.values
DataFrame → 리스트: df.values.tolist()
리스트로의 변환은 values로 얻은 ndarray에 tolist()를 호출
list_dict = df_dict.values.tolist()
DataFrame → 딕셔너리: df.dict()
인자로 'list'를 입력하면 딕셔너리의 value값이 리스트형으로 반환
만약 입력하지 않으면 value의 값이 딕셔너리형으로 반환됨
dict3 = df_dict.to_dict('list')
DataFrame의 column data set 생성과 수정
새로운 column 생성
DataFrame [ ] 내에 새로운 column 명을 입력하고 값을 할당
상수값을 할당하면 해당 column의 모든 데이터에 일괄적으로 적용
titanic_df['Age_0'] = 0
기존 column 값 수정
기존 column 에 값을 업데이트 하려면 해당 컬럼에 업데이트 값을 그대로 지정
titanic_df['Age_by_10'] = titanic_df['Age'] * 10
titanic_df['Family_No'] = titanic_df['SibSp'] + titanic_df['Parch'] + 1
titanic_df['Age_by_10'] = titanic_df['Age_by_10'] + 100
DataFrame 데이터 삭제
drop()
DataFrame.drop(labels=None, axis=0, index=None, columns=None, level=None, inplace=False, errors='raise')이중 중요한 파라미터는 labels, axis, inplace
labels: 원하는 칼럼 명 입력
axis=0: 로우 방향 drop, axis=1: 칼럼 방향 drop
inplace=True: 원본 DataFrame 변경, inplace=False: 삭제된 결과 DataFrame 반환 (default: inplace=False)
참고로 drop() 시 inplace=True로 설정하면 반환 값이 None
따라서 inplace=True로 설정한 채로 반환 값을 다시 원본 DataFrame 객체로 할당하면 안됨
## column 방향 drop
# inplace=False
titanic_drop_df = titanic_df.drop('Age_0', axis=1 )

# inplace=True
titanic_df.drop(['Age_0', 'Age_by_10', 'Family_No'], axis=1, inplace=True)

## row 방향 drop
titanic_df.drop([0,1,2], axis=0, inplace=True)
Index 객체
df.index
index 객체 추출
index 객체는 식별성 데이터를 1차원 array로 가지고 있음
따라서 ndarray와 유사하게 단일 값 반환 및 슬라이싱 가능
그러나 [ ] 를 이용하여 임의로 index의 값 변경 불가
indexes = titanic_df.index
print(indexes)

# return: RangeIndex(start=0, stop=891, step=1)

print(indexes.values[:5])
print(indexes[6])
# indexes[0] = 5 불가
df.index.values
index 객체를 실제 값 array로 변환
print('Index 객체 array값:\n',indexes.values)

# return: [  0   1   2   3   4   5   6   7   8   9  10  11  12  13  14  15  16  17
#          ............. 882 883 884 885 886 887 888 889 890]
df.reset_index()
새롭게 인덱스를 연속 숫자형으로 할당
기존 인덱스는 'index'라는 새로운 column 명으로 추가
인덱스가 연속된 int 숫자형 데이터가 아닐 경우 다시 이를 연속 int 숫자형 데이터로 만들 때 주로 사용
new_value_counts = value_counts.reset_index(inplace=False)
print(new_value_counts)

/*
return:    index  Pclass
        0      3     491
        1      1     216
        2      2     184
*/
데이터 셀렉션 및 필터링
DataFrame [ ] 연산자
DataFrame의 [ ] 내에 column 명이 아닌 숫자 값을 입력하면 오류 발생
그러나 판다스 인덱스 형태로 반환 가능한 표현식은 [ ] 내에 입력할 수 있음
예를 들어, DataFrame의 처음 2개의 데이터를 추출하는 경우는 가능
또한 불린 인덱싱 표현도 가능
titanic_df[0:2]
titanic_df[ titanic_df['Pclass'] == 3].head(3)
DataFrame iloc[ ] 연산자
iloc[]는 위치 기반 인덱싱만 허용하기 때문에 행과 열 값으로 integer 또는 integer 형의 슬라이싱, 팬시 리스트 값을 입력
iloc[]에 위치 인덱싱이 아닌 명칭을 입력하면 오류 발생
data_df.iloc[0, 1]
DataFrame loc[ ] 연산자
loc[]는 명칭 기반으로 데이터 추출
따라서 행 위치에는 DataFrame index 값을, 열 위치에는 column 명 입력
loc[]에 슬라이싱 기호 ':'를 적용할 수 있는데, 주의할 것은 '시작:종료'로 지정하면 <시작 값~종료 값 - 1>까지의 범위가 아닌 <시작 값~종료 값>까지의 범위
print(data_df.loc['one':'two', 'Name'])
불린 인덱싱
불린 인덱싱은 loc[] 연산자에도 적용 가능
여러 개의 복합 조건도 결합해 적용 가능
- and: &
- or: |
- not: ~
titanic_df[titanic_df['Age'] > 60].head()
titanic_df[titanic_df['Age'] > 60][['Name','Age']].head()

# loc[ ]
titanic_df.loc[titanic_df['Age'] > 60, ['Name','Age']].head()

# 복합 조건
titanic_df[ (titanic_df['Age'] > 60) & (titanic_df['Pclass']==1) & (titanic_df['Sex']=='female')]

# 조건식은 변수로도 할당 가능
cond1 = titanic_df['Age'] > 60
cond2 = titanic_df['Pclass']==1
cond3 = titanic_df['Sex']=='female'
titanic_df[ cond1 & cond2 & cond3]
정렬, Aggregation 함수, GroupBy 적용
sort_values()
DataFrame, Series 정렬
주요 파라미터
by: 특정 column으로 정렬 수행
ascending: True로 설정하면 오름차순으로 정렬.
False로 설정하면 내림차순으로 정렬.
default는 True
inplace: True로 설정하면 원본 DataFrame 변형
False로 설정하면 원본 DataFrame을 유지하고 정렬된 DataFrame 반환
default는 False
titanic_df.sort_values(by='Pclass', ascending=True)
titanic_df.sort_values(by=['Pclass', 'Name'], ascending=True)
titanic_df[['Name','Age']].sort_values(by='Age')
titanic_df[['Name','Age','Pclass']].sort_values(by=['Pclass','Age'])
Aggregation 함수 적용
aggregation을 호출할 경우 모든 column에 해당 aggregation을 적용
특정 칼럼에 aggreagation 함수를 적용하기 위해서는 DataFrame에 대상 칼럼들만 추출해 aggregation을 적용
참고로 count() 함수는 NaN 값을 제외하고 count
- count()
- min()
- max()
- sum()
titanic_df.count()
titanic_df[['Age', 'Fare']].mean(axis=1)
titanic_df[['Age', 'Fare']].count()
groupby() 적용
by 인자에 Group By 하고자 하는 컬럼을 입력
여러 개의 column으로 Group by 하고자 하면 [ ] 내에 해당 column 명을 입력
DataFrame에 groupby( )를 호출하면 DataFrameGroupBy 객체를 반환
groupby()를 호출해 반환된 결과에 aggregation 함수를 호출하면 groupby() 대상 column을 제외한 모든 column에 해당 aggregation 함수를 적용

groupby()에 특정 column만 aggregation 함수를 적용하려면 DataFrameGroupBy 객체에 해당 column을 필터링한 뒤 aggregation 함수 적용

groupby()에 여러 aggregation 함수를 적용할 경우에는 agg() 함수 내 인자로 입력해서 사용
예를 들어, 'Age' 칼럼의 max와 min 값을 알고 싶다면 다음과 같이 입력

그러나 만약 여러 개의 칼럼이 서로 다른 aggregation 함수를 groupby에서 호출하려면 딕셔너리 형태로 aggregation 함수를 입력

결손 데이터 처리
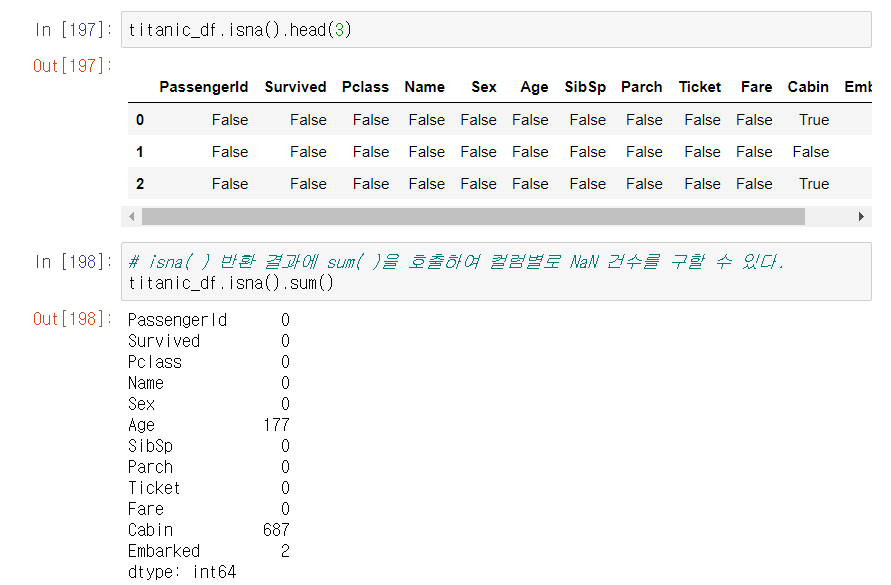
isna()
데이터가 NaN인지 아닌지 알려줌
DataFrame에 isna()를 수행하면 모든 column 값이 NaN인지 아닌지 True나 False로 알려줌
결손 데이터의 개수는 isna() 결과에 sum() 함수를 추가해 구할 수 있음
sum() 호출시 True는 내부적으로 숫자 1, False는 숫자 0으로 변환
fillna()
결손 데이터를 다른 값으로 대체
fillna()를 이용해 반환 값을 다시 받거나 inplace 파라미터를 True로 설정해야 함 (default는 False)
titanic_df['Cabin'] = titanic_df['Cabin'].fillna('C000')
titanic_df['Age'] = titanic_df['Age'].fillna(titanic_df['Age'].mean())
titanic_df['Embarked'] = titanic_df['Embarked'].fillna('S')
apply lambda 식으로 데이터 가공
df,apply(lambda)
람다식에 if 절을 사용할 경우 if 식보다 반환 값을 먼저 기술
ex) lambda x: 반환 값 if ~
또한 if, else만 지원하고 else if는 지원하지 않음
따라서 elif를 이용하기 위해서는 else 절에 ( )를 내포해 ( ) 내에서 if else를 적용
만약 조건식이 너무 길어질 경우에는 별도의 함수를 만들 수도 있음
titanic_df['Name_len']= titanic_df['Name'].apply(lambda x : len(x))

# 조건식
titanic_df['Child_Adult'] = titanic_df['Age'].apply(lambda x : 'Child' if x <=15 else 'Adult' )
titanic_df['Age_cat'] = titanic_df['Age'].apply(lambda x : 'Child' if x<=15 else ('Adult' if x <= 60
                                                                                          else 'Elderly'))

# 조건식이 길어질 경우
def get_category(age):
    cat = ''
    if age <= 5: cat = 'Baby'
    elif age <= 12: cat = 'Child'
    elif age <= 18: cat = 'Teenager'
    elif age <= 25: cat = 'Student'
    elif age <= 35: cat = 'Young Adult'
    elif age <= 60: cat = 'Adult'
    else : cat = 'Elderly'

    return cat

titanic_df['Age_cat'] = titanic_df['Age'].apply(lambda x : get_category(x))
titanic_df[['Age','Age_cat']].head()'내가 보려고 만드는 > 파이썬' 카테고리의 다른 글
| [판다스] Object 타입 날짜를 datetime 타입으로 변경하기 (0) | 2021.08.09 |
|---|---|
| [파이썬] 문자 아스키코드 변환 (0) | 2021.08.01 |
| [파이썬 - Numpy] 자주 쓰이는 함수 정리 (0) | 2021.07.30 |
| [파이썬] 리스트에서 최대 값과 최소 값의 index 찾기 (0) | 2021.07.24 |
| [파이썬] 문자열 리스트, 문자열 길이를 기준으로 정렬 (0) | 2021.07.24 |